Customizing Analysis Visual Styles
For all analysis types, default analysis display styles are used to visualize results. The steps below will allow you to modify these or create your own.
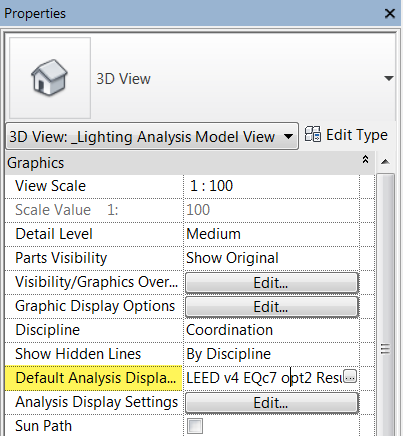
Open any view that has visible analysis results. In the Properties panel, select the […] for Default Analysis Display Style.
The Analysis Display Styles dialog will appear. The styles on the left are all default styles. Select any one of these to see change the visualization style in the current view.
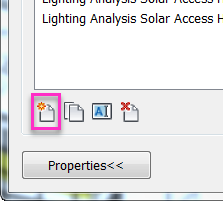
To create your own style, select New.
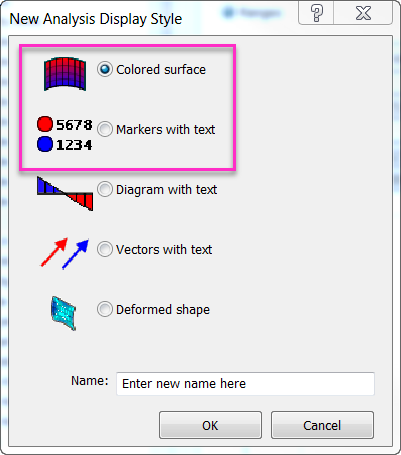
For lighting analysis results, Colored surface and Markers with text are the styles that should be used.
Control the Settings, Color, and Legend in the respective tabs.
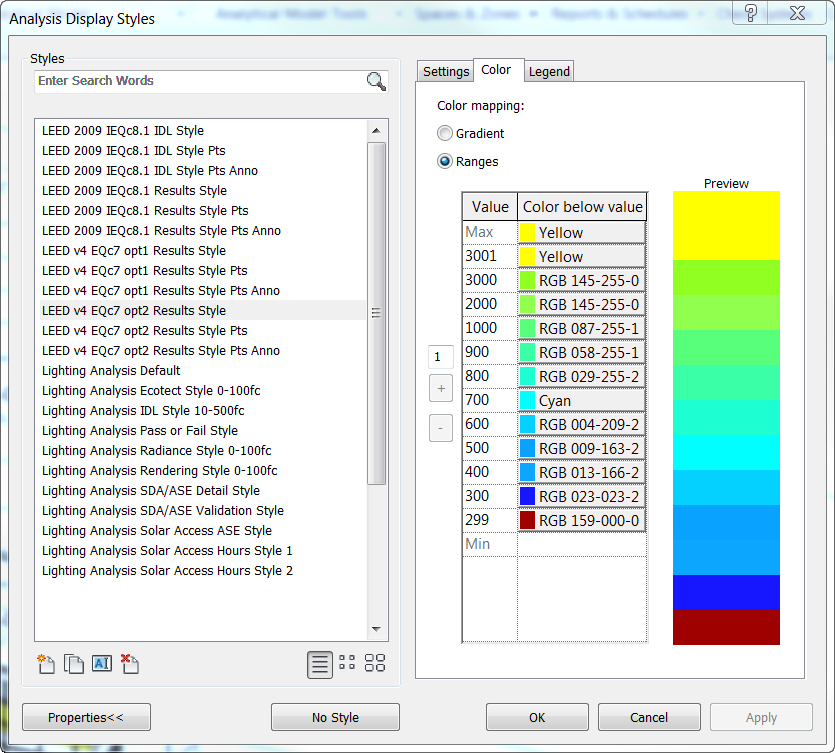
Adding values associated with specific colors will allow you to highlight specific thresholds.